North Orange County Housing Market Updates Homepage
Our North Orange County housing market update is updated automatically every day with the latest real estate data from TrendGraphix via the CRMLS.
With direct links to city-specific updates for Brea, Yorba Linda, Placentia, Fullerton, La Habra, and Anaheim Hills, this page serves as your hub for understanding both local and regional housing trends in North Orange County.
North OC Single Family Homes
North OC Condos & Townhomes
The numbers above show the most current North OC housing market data with single family homes and condos & townhomes, updated daily and compared to the same time last year. This gives you a clear picture of how the North OC real estate market is changing and helps you understand whether prices and demand are trending up or down.
Avg. Active Price shows the current average asking price for properties listed in North OC. This helps both buyers and sellers understand where the market stands today.
Avg. Sold Price represents what properties have actually sold for recently, giving valuable insight into current property values and price trends in North OC.
For Sale Listings reflect how many active properties are on the market in North OC. A higher number means more options for buyers, while fewer listings suggest a tighter, more competitive market.
Sold Listings are properties that have recently closed escrow. Tracking sold listings helps identify true buyer demand and the prices properties are actually selling for in North OC.

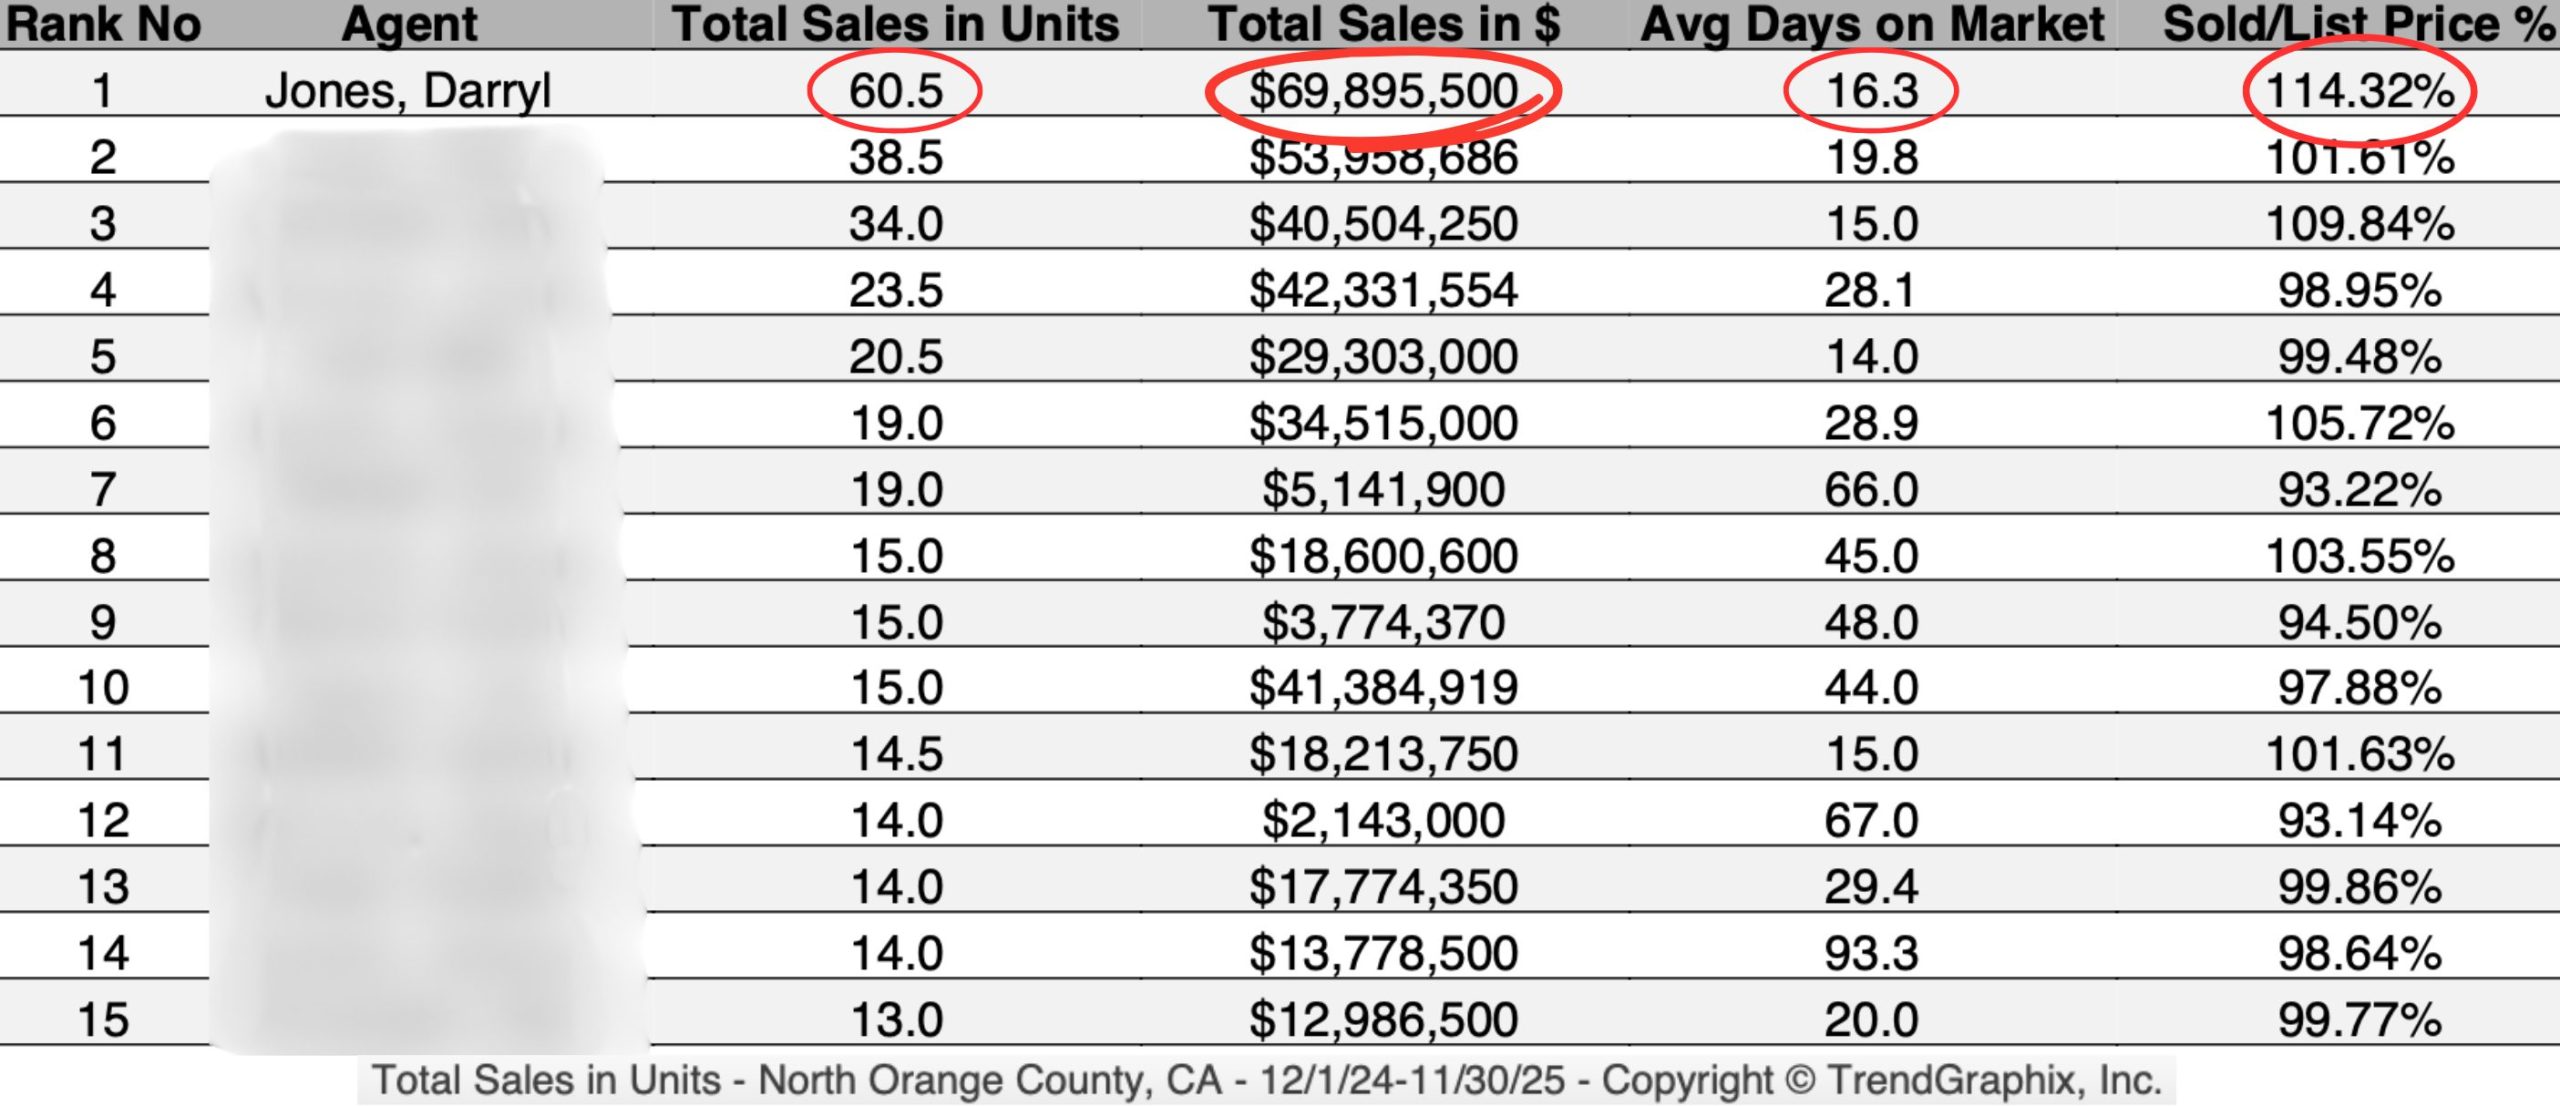
According to TrendGraphix, Darryl Jones is the #1 realtor in North Orange County.


📲 For a personalized North Orange County housing market breakdown, call Darryl Jones at (714) 713-4663.
And be sure to watch Darryl’s North Orange County Market Updates Playlist on YouTube. Since 2016, he's shared in-depth analysis on what today’s numbers mean for buyers and sellers.


Darryl & JJ JONes team - Era north orange county real estate | 18431 Yorba Linda Blvd. yorba linda, ca 92886 | 714.713.4663 | darrylandjj@gmail.com | DRE # 01076312
Terms Of Use | Privacy Policy | Accessibility Statement | Fair Housing Notice
© 2025 MoxiWorks
©2022 ERA Franchise Systems LLC. All Rights Reserved. ERA Franchise Systems LLC fully supports the principles of the Fair Housing Act and the Equal Opportunity Act. Each ERA Office is Independently Owned and Operated. ERA and the ERA logo are service marks of ERA Franchise Systems LLC.

